
Recently I have been working on a Kaggle competition where participants are tasked with predicting Russian housing prices. In developing a model for the challenge, I came across a few methods for selecting the best regression
model for a given dataset. Let’s load up some data and take a look.
library(ISLR)
set.seed(123)
swiss <- data.frame(datasets::swiss)
dim(swiss)
## [1] 47 6
head(swiss)
##              Fertility Agriculture Examination Education Catholic
## Courtelary        80.2        17.0          15        12     9.96
## Delemont          83.1        45.1           6         9    84.84
## Franches-Mnt      92.5        39.7           5         5    93.40
## Moutier           85.8        36.5          12         7    33.77
## Neuveville        76.9        43.5          17        15     5.16
## Porrentruy        76.1        35.3           9         7    90.57
##              Infant.Mortality
## Courtelary               22.2
## Delemont                 22.2
## Franches-Mnt             20.2
## Moutier                  20.3
## Neuveville               20.6
## Porrentruy               26.6
This data provides data on Swiss fertility and some socioeconomic
indicators. Suppose we want to predict fertility rate. Each observation
is as a percentage. In order to assess our prediction ability, create
test and training data sets.
index <- sample(nrow(swiss), 5)
train <- swiss[-index,]
test <- swiss[index,]
Next, have a quick look at the data.
par(mfrow=c(2,2))
plot(train$Education, train$Fertility)
plot(train$Catholic, train$Fertility)
plot(train$Infant.Mortality, train$Fertility)
hist(train$Fertility)
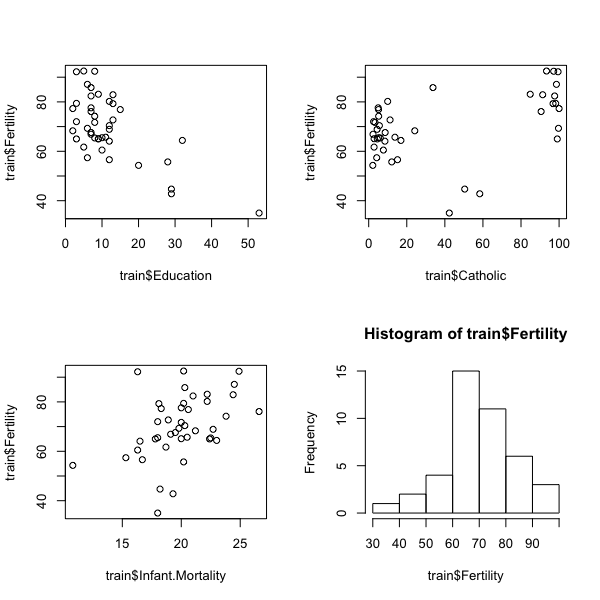
Looks like there could be some interesting relationships here. The
following block of code will take a model formula (or model matrix) and
search for the best combination of predictors.
library(leaps)
leap <- regsubsets(Fertility~., data = train, nbest = 10)
leapsum <- summary(leap)
plot(leap, scale = 'adjr2')

According to the adjusted R-squared value (larger is better), the best
two models are: those with all predictors and all predictors less
Examination. Both have adjusted R-squared values around .69 – a decent fit. Fit these models so we can evaluate them further.
swisslm <- lm(Fertility~., data = train)
swisslm2 <- lm(Fertility~.-Examination, data = train)
#use summary() for a more detailed look.
First we'll compute the mean squared error (MSE).
mean((train$Fertility-predict(swisslm, train))[index]^2)
## [1] 44.21879
mean((train$Fertility-predict(swisslm2, train))[index]^2)
## [1] 36.4982
Looks like the model with all predictors is marginally better. We're
looking for a low value of MSE here. We can also look at the Akaike
information criterion (AIC) for more information. Lower is better here
as well.
library(MASS)
step1 <- stepAIC(swisslm, direction = "both")
step1$anova
## Stepwise Model Path
## Analysis of Deviance Table
##
## Initial Model:
## Fertility ~ Agriculture + Examination + Education + Catholic +
##     Infant.Mortality
##
## Final Model:
## Fertility ~ Agriculture + Education + Catholic + Infant.Mortality
##
##
##            Step Df Deviance Resid. Df Resid. Dev      AIC
## 1                                  36   1746.780 168.5701
## 2 - Examination  1 53.77608        37   1800.556 167.8436
Here, the model without Examination scores lower than the full
model. It seems that both models are evenly matched, though I might be
inclined to use the model without Examination.
Since we sampled our original data to make the train and test datasets,
the difference in these tests is subject to change based on the training
data used. I encourage anyone who wants to test themselves to change the
set.seed at the beginning and evaluate the above results again. Even
better: use your own data!
If you learned something or have questions feel free to leave a comment
or shoot me an email.
Happy modeling,
Kiefer

You should evaluate your model on the test data, not the train data. Adding more predictors will always give a better result on the training set.
Also, you should use the same sample to create the test and train sets. Your test set is entirely contained in the training set!
> set.seed(123)
> intersect(sample(47, 5), 1:47[-sample(47, 5)])
[1] 14 37 19 39 41
LikeLiked by 1 person
Hey, Kent, you’re absolutely right. Initially I had things working the right way, but I changed a few things. Will correct these errors ASAP! Thank you for your comment.
LikeLike
Why not use Adjusted AIC if you’re going to be comparing models with varying numbers of predictors?
LikeLike
I’m not familiar with that form of assessment. Please elaborate!
LikeLike
Isn’t stepwise regression a no-no?
http://www.stata.com/support/faqs/statistics/stepwise-regression-problems/
LikeLike
Seems like people favor hierarchical selection over stepwise, though stepwise can be okay in certain instances. Might have to do another post comparing the two.
LikeLike
Keifer,
How’s Sberbank treating you? I just blew up an R session trying to run vimp (randomForestSRC) against Boruta. Use fewer cores is the conclusion. Sberbank is interesting as it is a supply demand problem but supply is never stated, as best as I can work out. Anyway, I’m down in the 0.33s so way off the LB.
Chris English
LikeLiked by 1 person
Hey, Chris. It’s an interesting challenge for sure. I’m far from a statistician – and mainly using the data to practice on – but I had decent results using a simple linear model (with price_doc log transformed). Split up my data between OwnerOccupied and Investment property types. My current approach is to use aggregated (by month and year since it is largely incomplete) macro data and joining that to the property information. Not super familiar with random forests or more advanced selection techniques, but I feel that, with this much data it’s a requirement. Would be interested to see your working solution!
LikeLike
Keifer,
Anytime I run with macro my scores go down, generally pretty considerably. I think the key is to be found in the investor/owner split, and that probably the macro data isn’t helping as there is something like a bet against the new inventory in Sberbank’s holdings (I think the market is overbuilt substantially), though I’ve been having difficult characterizing this: https://www.kaggle.com/cenglish/everything-is-underwritten that I can back to when the latest model finishes, probably teasing out both year and value.
There is this discussion, https://www.kaggle.com/c/sberbank-russian-housing-market/discussion/32717#182069 that talks about down sampling investor holdings at given price points, with R code, which makes it sound like investor induces noise, though could also be class imbalance, like you not a statistician.
Began running a caret this morning and find I’m running another random forest, (was following a tutorial that didn’t mention the blood and guts) but on one core, so, in a couple of days, perhaps it will finish and will see. Otherwise, I hover just above 0.33, Ah well.
Chris
LikeLike
Yeah, I think most of the macro data is noise, but there’s got to be some relation between supply/ demand to loans and such. The investor data definitely has some weird relationships going on. Keep me updated on your progress!
LikeLike
Hey Keifer,
Thank you for your article.
Maybe I am a little too old school in my approach, but the idea of having a programmatic approach that simply tests all combinations of predictors and identifies those with the highest R-squared goes against everything I have been taught. It might be that the five predictors have, outside of this article, all been identified based on a-priori expectations of how they would affect fertility. If so, I guess it could make sense how tested all combinations.
Also, echoing Kent’s comment, in any model, we would expect more variables to result in a greater R-squared. I think “a” goal in any model is to try and get as good a fit as possible with as few variables as possible.
Thanks again – I would be interested in a post on stepwise vs. hierarchical if you get the time.
LikeLike
Hey, Marc, thank you for your comment. With this data it seems that the predictors have been hand-picked, but – generally – I can see how stepping through all possible model combinations could result in a sub-optimal model.
I evaluated the models initially on adjusted R-squared for the purpose of accounting for more vs. fewer predictors. I am not a statistician, though!
Looking into alternatives now; ridge regression and the lasso are on the docket today.
Thanks again!
LikeLike
It seems to be taken as given that the predictors have all linear effects on the response. That seems unrealistic to me. In data dredging, I always include quadratic and first-order interactive effects. It seems that the majority of blog posts (and text books) pretends to live in a linear world.
LikeLike
I agree with you.
LikeLike